
Study of rocks from mining processing plants of the Murmansk region by use electric pulse disintegration materials method
 A.S. Potokin1, V.V. Kolobov2
1 Electric pulse disintegration technologies Limited Liability Company (LLC "EPD Technologies"), Murmansk region, Apatity, Russian Federation
2 Center for Physical and Technical Problems of the Energy of the North – a branch of the Federal State Budgetary Institution of Science of the Federal Research Center “Kola Scientific Center of the Russian Academy of Sciences”, Apatity, Russian Federation
Russian Mining Industry №5 / 2022 р. 135-138
Abstract: Data on the general and specific energy characteristics of the electric pulse impact on rock samples of mining and processing plants of the Murmansk region, allowing to determine the required amount of energy in a pulse to achieve the effect of maximum release of useful components were obtained. The data of chemical analysis of rocks before and after electric pulse disintegration confirm the high efficiency of using the method to increase the release of useful components from rock samples of mining and processing plants were obtained. The results of the scientific work laid the foundation for research and development work by evaluating the effectiveness of the use of an electric pulse method on various rocks enriched at mining and processing plants for creation of an industrial electric pulse installation for mining processing plants.
Keywords: electric pulse disintegration, industrial electric pulse installation, pre-weakening rocks
Acknowledgment: The works was carried out within the framework of the project "Creation of an industrial electric pulse installation to increase the efficiency of the development of ore deposits" with the support of the Fund for Assistance to the Development of Small Forms of Enterprises in the Scientific and Technical Sphere (Innovation Assistance Fund). Program "START-1", No. 3614GS1 / 60501 dated 07/20/2020.
For citation: Potokin A.S., Kolobov V.V. Study of rocks from mining processing plants of the Murmansk region by use electric pulse disintegration materials method. Russian Mining Industry. 2022;(5):135–138. https://doi.org/10.30686/1609-9192-2022-5-135-138
Article info
Received: 30.08.2022
Revised: 26.09.2022
Accepted: 28.09.2022
Information about the authors
Alexander S. Potokin – General Director of Electric pulse disintegration technologies Limited Liability Company (LLC "EPD Technologies"), Murmansk region, Apatity, st. Lenina, 27, office 310, This email address is being protected from spambots. You need JavaScript enabled to view it.;
Vitaly V. Kolobov – Head of the Laboratory of Electric Power Industry and Electrical Technology of the Center for Physical and Technical Problems of the Energy of the North – a branch of the Federal State Budgetary Institution of Science of the Federal Research Center “Kola Scientific Center of the Russian Academy of Sciences”, Apatity, Russian Federation
Introduction
The electric pulse disintegration (EPD) of mineral raw materials is based on the creation of an electrical breakdown channel in the material being destroyed by applying a high voltage to the sample and the subsequent rapid expansion of the breakdown channel inside the sample [1; 2]. In this case, unlike traditional mechanical crushing methods that use compression and shear deformations, the sample experiences tensile deformations in the directions of channel expansion. The electrical breakdown of minerals is carried out in dielectric liquids, of which process water is the most commonly used. The introduction of the discharge into the sample occurs only when the volt-second characteristic (dependence of the breakdown voltage on the duration of the applied pulse, VSC) of the breakdown of the mineral placed in the liquid is lower than the VSC of the breakdown of the liquid surrounding the sample. The electrical breakdown channel mainly develops along phase boundaries in inhomogeneous materials, along gas cavities and conductive inclusions in homogeneous solid materials, along lattice defects and boundaries of crystallographic planes in materials with a crystalline structure [3–5]. The conditions for the effective introduction of the discharge into the rock and its destruction can be formulated as follows:
– for the electrical breakdown of minerals, a sufficient amplitude of the pulse voltage is required, which exceeds the electrical strength of the minerals;
– in order to exceed the VSC of the breakdown of the dielectric liquid of the level of the VSC of minerals, a sufficiently steep front of the voltage pulse must be formed to ensure the introduction of a spark discharge into the rock;
– for the post-breakdown destruction of the rock, it is necessary to provide a sufficient amount of energy in the discharge.
The study of rocks of mining and processing plants on a laboratory sample of an electric pulse disintegration
The process of electric pulse fragmentation, destruction, disintegration, pre-weakening of rocks, ores and other materials, mainly occurs using Arkadiev-Marx generation schemes [6–8]. To conduct experiments on the impact on rock samples, a generator of pulsed voltages of positive polarity we also was used, assembled according to the Arkadiev-Marx scheme. The crushing and grinding chamber acted as a working container for crushing. The schematic diagram of the model installation is shown in Figure 1.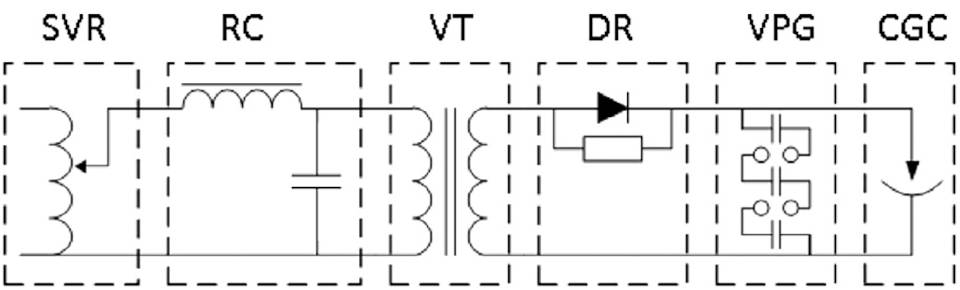
Fig. 1 Schematic diagram of the laboratory installation: SVR – single-phase voltage regulator, RC – resonant converter, VT – voltage transformer, DR – diode rectifier, VPG – voltage pulse generator, CGC – crushing and grinding chamber
Рис. 1 Принципиальная схема лабораторной установки: SVR – однофазный регулятор напряжения, RC – резонансный преобразователь, VT –трансформатор напряжения, DR – диодный выпрямитель, VPG – генератор импульсов напряжения, CGC – камера дробления и измельчения
In experiments on grinding rocks, sieves with cells of 15 and 5 mm were used as a grounded electrode. When exposed to pulp of rock, instead of sieves, a metal bowl with a hemispherical shape of the inner side was used. After several initial pulses, the pulp shrunk, so the length of the working gap changed once, but most of the pulses were applied at a constant set length of the gap.
Electric pulse impact on rock samples was carried out at the maximum energy parameters of VPG. This approach was due to the fact that the electrical properties of some rock samples were not known. The operating design and energy parameters of the installation are shown in Table 1.
Table 1 Operating parameters of the lab EPD installation
Таблица 1 Рабочие параметры лабораторной установки для электроимпульсной дезинтеграции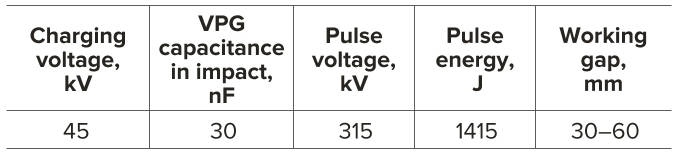
When conducting experiments with pulp of rock, the voltage at the load and the current through the load were measured using a resistive voltage divider and a current shunt.
The crushing experiments were carried out in several stages. A fraction less than 2 mm was taken as the minimum fraction in the classification of crushing output products. The experiments were completed when fractions less than 0.25 mm and less than 0.5 mm were separated from the total amount of fractions less than 2 mm from all stages for comparison with control samples. Control samples: 1. Iron quartzites of medium crushing; 2. Finely crushed ferruginous quartzites; 3. Pulp after fine crushing; 4. Apatite-nepheline ore of medium crushing; 5. Apatite-nepheline ore of fine crushing; 6. Apatite-nepheline ore pulp Figure 2 shows typical oscillograms of the processes of electric pulse action on pulps of ferruginous quartzites and apatitenepheline ore. The difference in the shape and magnitude of the voltage indicates the high conductivity of the pulp, while the pulp at the initial moments of time exhibits dielectric properties, which explains the delay in the breakdown of the gap by 0.6 μs.
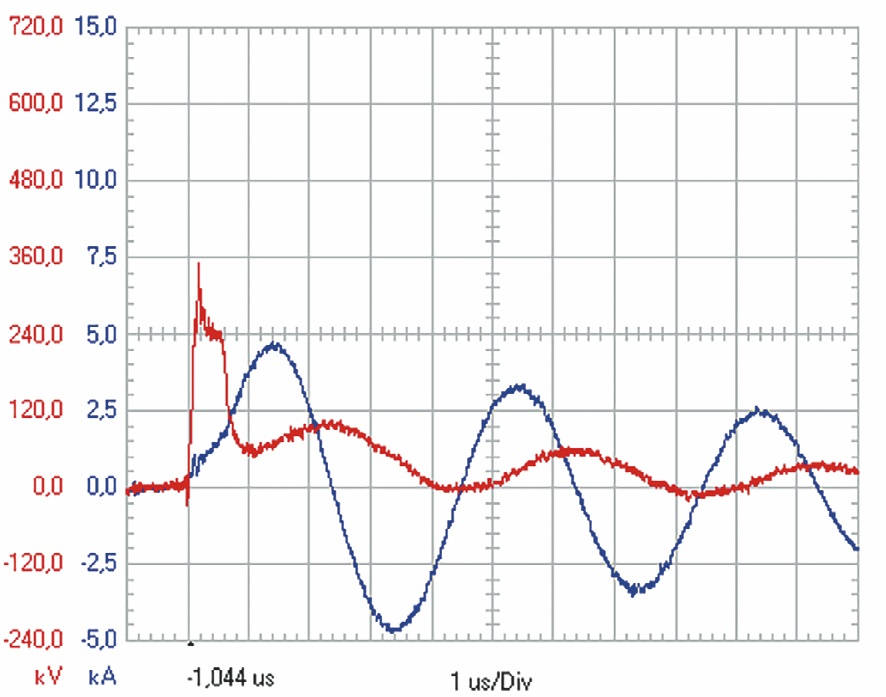 Fig. 2 Oscillogram of voltage and current during breakdown of gaps with pulp
Рис. 2 Осциллограмма напряжения и тока при пробое зазоров с пульпой
The masses of rock samples for electric pulse action were selected based on the amount of available large-sized material. The specific energy costs for electric pulse disintegration were calculated in relation to the mass of the useful fraction without taking into account the non-crushed material. Experiments on electric pulse disintegration were divided into 3 stages: 1. Electric pulse disintegration of rocks on a sieve +15 mm (Table 2); 2. Electric pulse disintegration of rocks on a +5 mm sieve with a decrease in the working gap in the crushing and grinding chamber to a critical length of 30 mm, after which the electric pulse action turned into electrohydraulic (Table 3); 3. Electric pulse disintegration of rocks was carried out on a 2 mm sieve, fractions –5 + 2 mm on a 5 mm sieve. Crushing was carried out until the critical length of the working gap in the chamber was reached (Table 4).
Table 2 Sample weights and energy costs for EPD on 15 mm sieve
Таблица 2 Масса образцов и затраты энергии на электроимпульсную дезинтеграцию на сите 15 мм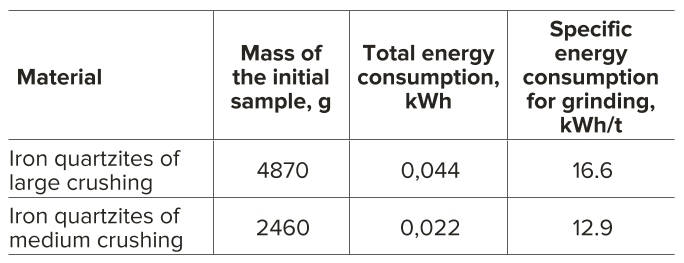 Table 3 Sample weights and energy costs for EPD on 5 mm sieve
Таблица 3 Масса образцов и затраты энергии на электроимпульсную дезинтеграцию на сите 5 мм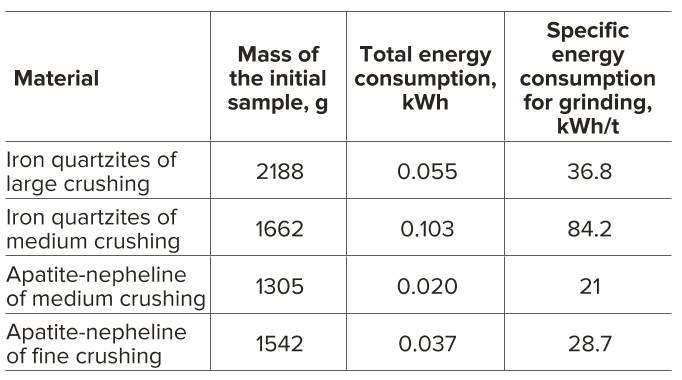 Table 4 Sample weights and energy costs for EPD on 2 mm sieve
Таблица 4 Масса образцов и затраты энергии на электроимпульсную дезинтеграцию на сите 2 мм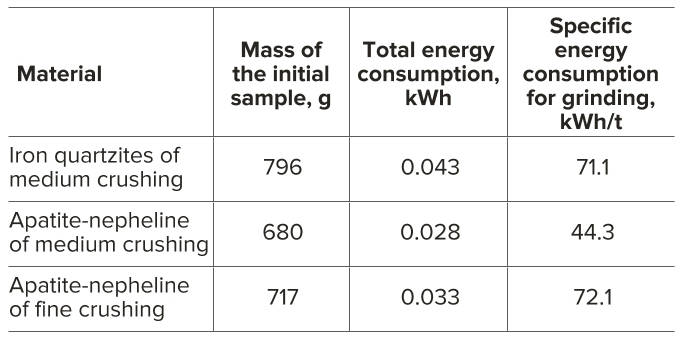
Results of chemical analysis before and after EPD
Below in Table 5 are the results of chemical analysis of samples of rocks, ores and pulps of mining and processing plants before and after electric pulse disintegration. Additional output of useful components from rock samples after electric pulse disintegration are indicated as a percentage of mass.
Table 5 Chemical analysis of rock samples of mining and processing plants before and after EPD
Таблица 5 Химический анализ образцов горных пород горно- обогатительных комбинатов до и после электроимпульсной дезинтеграции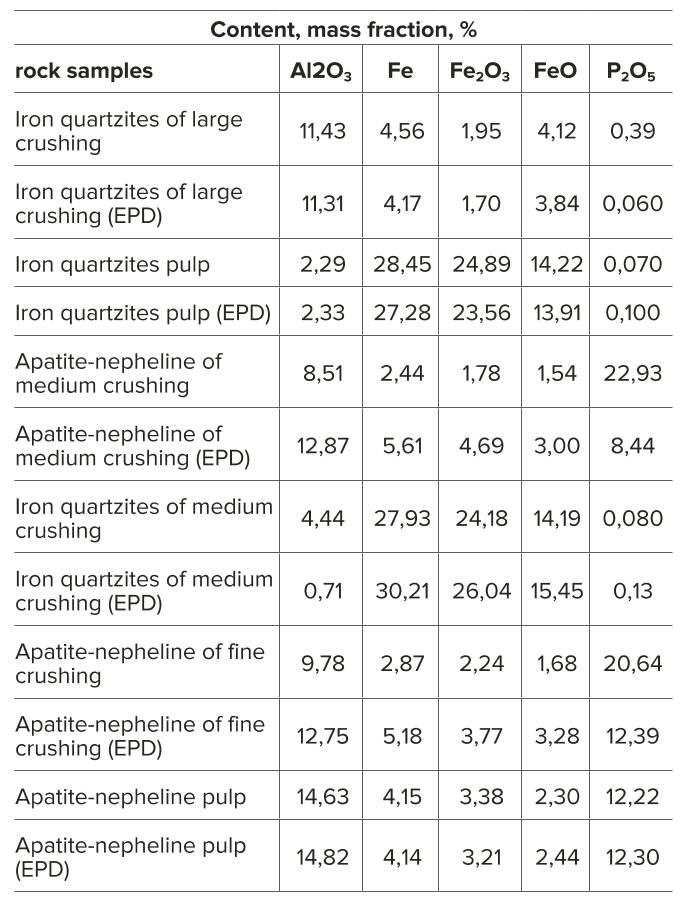
Conclusion
The obtained results of the conducted research and development made it possible to confirm the possibility of obtaining an additional yield of a useful component from rocks, ores and pulp of mining and processing plants after their electric pulse processing in comparison with control samples that were not subjected to electric pulse effects.
The results of the chemical analysis presented in Table 5 showed that after the electric pulse disintegration of the rock samples of mining and processing plants, the percentage of release of useful component such as Al2O3, Fe, Fe2O3, FeO, P2O5, depending on the fraction and the stages of rock crushing (large, medium, fine, pulp) can be increased by 7.59% and up to 113.79% respectively.
Mineralogical analysis of samples showed an additional yield of chemical elements such as SiO2, TiO2, MnO, CaO, MgO, K2O, Na2O, SrO, F, SO3. After electric pulse processing of rock samples, the yield of useful components can be increased by 9.07% and to118.3%.
References
1. Vorobyov A.A., Vorobyov G.A. Impulse breakdown of solid dielectrics. Bulletin of the Tomsk Polytechnic University. 1958;95:3–15. (In Russ.) Available at: http://earchive.tpu.ru/handle/11683/8824
2. Andres U.Ts. Liberation study of apatite-nepheline ore comminuted by penetrating electrical discharges. International Journal of Mineral Processing. 1977;4(1):33–38. https://doi.org/10.1016/0301-7516(77)90029-1
3. Remnev G.E., Isakov I.F., Opekounov M.S., Kotlyarevsky G.I., Kutuzov V.L., Lopatin V.S., Matvienko V.M., Ovsyannikov M.Yu., Potyomkin A.V., Tarbokov V.A. High-power ion beam sources for industrial application. Surface and Coatings Technology. 1997;96(1):103–109. https://doi.org/10.1016/S0257-8972(97)00116-3
4. Usov A.F., Tsukerman V.A. Electric pulse processes for processing of mineral raw materials: Energy aspect. In: Proceedings of 23rd International Mineral Processing Congress, Turkey, Istanbul, 3–8 September, 2006, pp. 2084–2090.
5. Usov A., Potokin A. Electric pulse disaggregation of materials – Russian experience. In: 26th International mineral processing congress, IMPC 2012: innovative processing for sustainable growth. New Delhi, September 24–28, 2012, pp. 5618–5626.
6. Zuo W., Shi F., Manlapig E. Electrical breakdown channel locality in high voltage pulse breakage. Minerals Engineering. 2014;69:196– 204. https://doi.org/10.1016/j.mineng.2014.08.006
7. Meylan B., Shevchik S.A., Parvaz D., Mosaddeghi A., Simov V., Wasmer K. Acoustic emission and machine learning for in situ monitoring of a gold–copper ore weakening by electric pulse. Journal of Cleaner Production. 2021;280-1:124348. https://doi.org/10.1016/j.jclepro.2020.124348
8. Huang W., Chen Y. The application of high voltage pulses in the mineral processing industry – A review. Powder Technology. 2021;393:116–130. https://doi.org/10.1016/j.powtec.2021.07.003


")